During the app development process, debugging helps developers quickly track and eliminate problems or bugs in their apps. Without app debugging, production apps may contain bugs that make them malfunction. While the emulators of most platforms have the Debugging option enabled by default, Android Wear’s does not. Fortunately, enabling debugging on this emulator is easy. Continue reading to find out how.
If you are new to Android development, you may also want to take a look at the post for basic Android debugging and filtering logcat. Debugging on Android Wear works the same way as it does on the traditional Android platform. In addition to that, you may want to check out how to connect the emulator to a real phone as well.
1. Start the Android Virtual Device (AVD) Manager from the SDK installation folder, and launch the Android wear emulator.
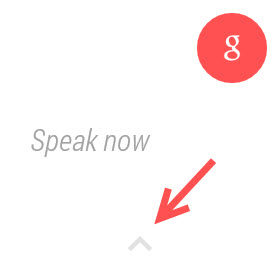
2. When the emulator has loaded completely, click anywhere inside the watch face to open Google Now. Next, click the arrow at the bottom of the screen to reveal hidden actions.
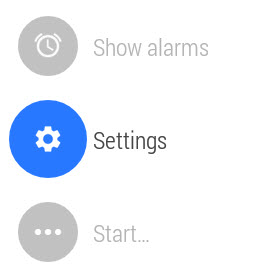
3. Scroll through the list of actions until you see the Settings option, and click on it to continue.
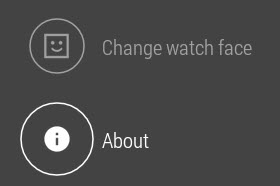
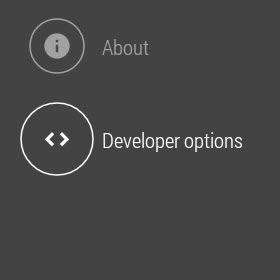
4. In the Settings section, scroll down to the bottom, and choose About. This is the place where you can view brief information about the emulator, as well as the option to show the hidden section for developers.
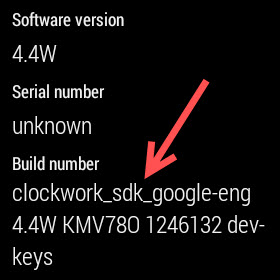
5. In the next screen, click on the Build number line seven times. The last time you click on it, a message stating that the Developer options are now available pops up on-screen as a confirmation. Come back to the previous screen, and you will see the new option there.
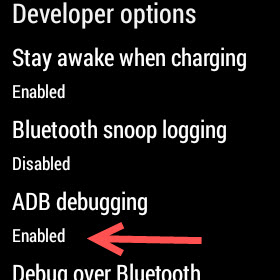
6. Now that you have successfully enabled the Developer options, you can enable ADB debugging easily. Additionally, you can turn on the Debug over Bluetooth option.


I went over this site and I believe you have a lot of good info , bookmarked (:.