An MTF chart represents the ability of a lens to accurately transfer contrast to the sensor. These scientific measurements allow photographers to compare aspects important to contrast reproduction, sharpness, and bokeh quality.
A lens transmits light to the censor. Not all lenses are designed through the same methods or the same degree of quality. Due to the number of elements, focal length and aperture, a lens has multiple characteristics that affects its performance. One of the most misunderstood measures of a quality lens is determined by its contrast range, also called contrast modulation. Therefore, we will be exploring charts describing the modulation transfer function (MTF) of a particular lens. Essentially, this chart describes how and when light is affected as it passes through the lens components.
Trust me, there is no lens in this world which is perfect. Every manufacturer sets priority to a certain feature when making lens. Manufacturers such as Carl Zeiss and Canon produce high quality lens due to their vigorous testing methods. One such quality is contrast transfer and this is represented with the MTF chart.
Measurement of Contrast
Optics engineers measure contrast in terms of Lines per millimeter. Logically, a line consists of black and white regions or pairs. In the below diagram you can compare the difference contrast ranges. A true black and white line has a sharp edge and a good range to differentiate white and black. Where the black and white is faded together, the contrast range is poor.
The basic physics of optics itself affects lens as well. For example, if you are taking a picture with a wide aperture and a shallow depth of field, the lines per millimeter will be less and thus the contrast range will not be as good. On the other hand, a picture taken with a higher depth of field and less aperture will have a better contrast range. The difference might be 10 line per millimeter for f2.8 to 30 line per millimeter for f8.0.
Reading an MTF Chart
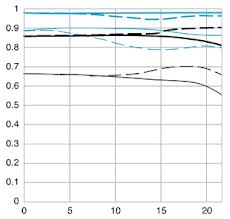
We are now ready to understand how to read an MTF chart. For our examples, I will be using MTF charts courtesy of Canon, Inc. Let us start with an MTF chart of Canon’s 100mm f2.8 macro lens.
The numbers on the vertical axis is measured from 0 to 100% and represented from 0 to 1 on the chart. For example, 0.1 would represent 10% while 1 equals 100%. This represents the amount of light the passes through the lens. The higher the percentage, the better the contrast. Generally, most experts consider above 60% (or .6) to be acceptable and above 80% (.8) superior levels for a lens.
The numbers on the horizontal axis are the measurements in millimeter in reference to the focal length of the lens. Zero is the center of the lens and 20 is out toward the edge of a lens. This lens, like all lenses, loses sharpness toward the outside of the lens. In the chart this loss is represented in the bending of the lines toward the right-side of the chart. The straighter the line, the greater amount that sharpness is preserved from the center to the edges of the photo.
The various lines are different measurements on the lens from different circumstances.
Line Weight
At its core an MTF chart provides measurements of contrast and sharpness. The line weights differentiate between these two major measurements.
Line Color
The color of the lines are showing the performance of the lens based on the depth of field. Therefore, these lines can be used to compare how a lens performs based on different apertures.
Line Type
The bokeh is how a lens represents an area of the photograph that is not in focus. By using these comparisons, you can estimate how pleasing the bokeh quality is.
Practical Use of MTF Charts
Below is a comparison of two different lenses. We can use the MTF Charts to compare resolution and contrast between lenses.


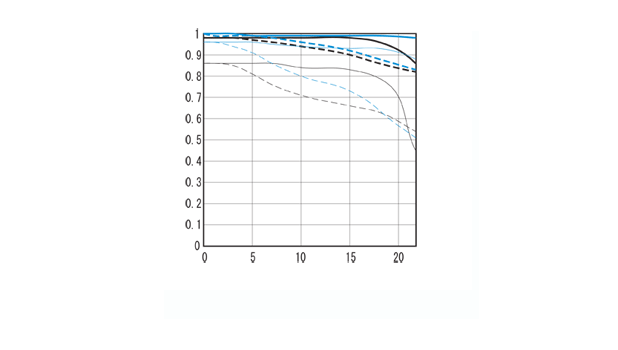
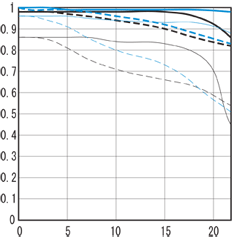
First, it is easy to notice the lines regarding the 135mm lens are all very similar; this means the lens is very consistent among the various measured characteristics. All of the lines are very high on the vertical axis suggesting the contrast and sharpness are impressive. Using this chart it becomes obvious why this prime lens is generally considered an excellent lens.
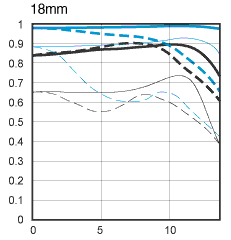
Compare this to the 18-55mm lens at 18mm. By the nature of their design, zoom lens lose light and quality based on their more complex designs. This can be visualized on the MTF chart. For example, all of our measured characteristics decrease in quality near the edges of the lens. This degrade in quality is increased when the lens is stopped down. Additionally, the bokeh quality is decreased when compared to the prime lens.
Although we used very different lens to demonstrate clear differences, typically MTF charts are used in practice to compare lenses of similar focal lengths.
Limitations
An MTF chart provides data about the sharpness and contrast of a lens. This tool ignores other very important factors when comparing lens such as vignetting, distortion, or lens flair. Different manufacturers generate MTF through different methods which makes comparing MTF data between companies difficult to interpret. Additionally, not all lens companies release MTF data which can make finding the charts difficult.


