As a new Macbook Air 11″ owner, my first impressions in regards to performance were very good. Even though my MBA 11 is running a slower CPU than my late 2009 Macbook Pro 13 (1.6ghz vs 2.26ghz), the MBA just seemed faster. Today we will take a look at some unofficial 3DMark2006 tests ran on both of my setups. These tests were ran in VMWare Fusion and in Boot Camp Windows 7 on both machines and in very similar test environments. Keep reading for all of the stats and numbers.
First things first, here are the physical specs on each of the machines we tested.
Macbook Pro 13″ (Late 2009 Model)
Intel C2D 2.26Ghz (P7550)
4GB DDR RAM
5400 RPM, SATAII Western Digital Harddrive (500GB)
Nvidia GeForce 9400M video (246MB)
Boot Camp – Windows 7 Ultimate Ed 64-Bit
Macbook Air (Late 2010 Model)
Intel C2D 1.6Ghz (Shows as a U9600 in 3DMark)
4GB DDR3 RAM
128GB SSD Flash
Nvidia GeForce 320M (322MB)
Boot Camp – Windows 7 Ultimate Ed 64-Bit
Test Notes / Environment:
I have both Macbooks setup with Boot Camp and Windows 7 Ultimate Edition (64bit) on each. Each is running the latest VMWare Fusion 3 for virtual machine testing and each VM is allocated the same 1 cpu core and 2GB of RAM.
I ran the default 3DMark 2006 benchmark on both machines in Windows 7 in both VMWare and booting to Windows 7 directly via Boot Camp. My virtual machine used was my Boot Camp Partition. I also ran each test twice to make sure results were not skewed.
The results may surprise and delight a few of you!
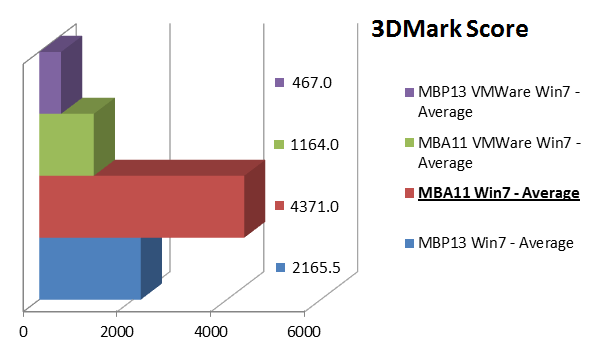
3D Mark Scores
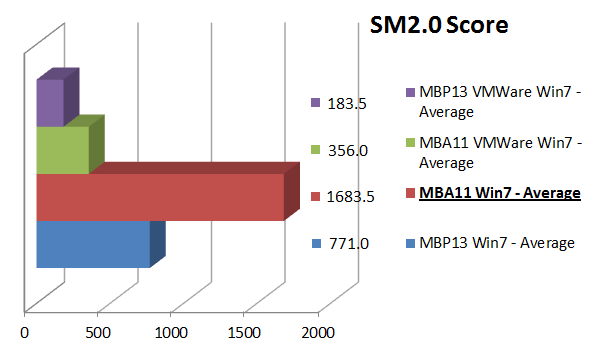
SM2.0 Scores
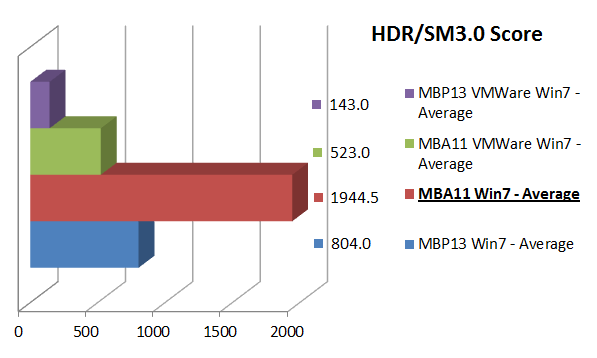
HDR / SM3.0 Scores
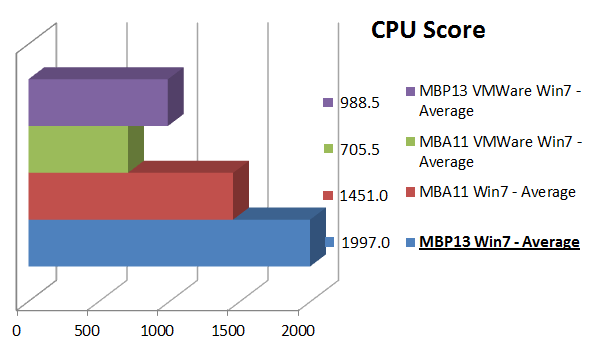
CPU Scores
Conclusion:
Some opponents and naysayers of the new Macbook Air 11″/13″ don’t really have much an argument against the CPU or overall speed of the laptop. Compared to most netbooks, the Macbook Air surpasses any of them with ease. Heck, it even bested my late 2009 Macbook Pro 13 on most tests except for the CPU score.
The numbers don’t lie and the experience you get does relate to the benchmark scores. I did feel like the Macbook Air felt faster and smoother running. VMware Fusion ran rather well on it and loaded my virtual Windows 7 much faster (Flash SSD definitely makes a difference in overall system speed vs my 5400RPM platter harddrive in the Macbook Pro 13). This test may not be the fairest one for the MBP13 since it didn’t have an SSD drive and in turn the numbers could jump back in its favor with such an upgrade. So there you have it, the stats and benchmarks.
Detailed numbers are below for the stat freaks 🙂
Detailed Score Results:
| System | 3DMark Score | SM2.0 Score | HDR/SM3.0 Score | CPU Score |
| MBP13 Win7 (Boot Camp) | 2164 | 771 | 802 | 1992 |
| MBP13 Win7 (Boot Camp) | 2167 | 771 | 806 | 2002 |
| MBP13 VMWare Win7 | 457 | 177 | 143 | 986 |
| MBP13 VMWare Win7 | 477 | 190 | 143 | 991 |
| MBA11 Win7 (Boot Camp) | 4370 | 1681 | 1946 | 1450 |
| MBA11 Win7 (Boot Camp) | 4372 | 1686 | 1943 | 1452 |
| MBA11 VMWare Win7 | 1165 | 356 | 523 | 707 |
| MBA11 VMWare Win7 | 1163 | 356 | 523 | 704 |
| MBP13 Win7 – Average | 2165.5 | 771 | 804 | 1997 |
| MBA11 Win7 – Average | 4371 | 1683.5 | 1944.5 | 1451 |
| MBA11 VMWare Win7 – Average | 1164 | 356 | 523 | 705.5 |
| MBP13 VMWare Win7 – Average | 467 | 183.5 | 143 | 988.5 |
________________________
| System | GT1 – Return to Proxycon | GT2 0 – Firefly Forest | CPU1 – Red Valley |
| MBP13 Win7 (Boot Camp) | 5.5 | 7.3 | 0.6 |
| MBP13 Win7 (Boot Camp) | 5.5 | 7.3 | 0.6 |
| MBP13 VMWare Win7 | 1.5 | 1.4 | 0.3 |
| MBP13 VMWare Win7 | 1.7 | 1.5 | 0.3 |
| MBA11 Win7 (Boot Camp) | 14.1 | 13.9 | 0.5 |
| MBA11 Win7 (Boot Camp) | 14.1 | 14 | 0.5 |
| MBA11 VMWare Win7 | 2.2 | 3.8 | 0.2 |
| MBA11 VMWare Win7 | 2.2 | 3.7 | 0.2 |
| MBP13 Win7 – Average | 5.5 | 7.3 | 0.6 |
| MBA11 Win7 – Average | 14.1 | 13.95 | 0.5 |
| MBA11 VMWare Win7 – Average | 2.2 | 3.75 | 0.2 |
| MBP13 VMWare Win7 – Average | 1.6 | 1.45 | 0.3 |
_________________
| System | CPU2 – Red Valley | HDR1 – Canyon Flight | HDR2 – Deep Freeze |
| MBP13 Win7 (Boot Camp) | 1 | 6.6 | 9.4 |
| MBP13 Win7 (Boot Camp) | 1 | 6.7 | 9.4 |
| MBP13 VMWare Win7 | 0.5 | 1.4 | 1.5 |
| MBP13 VMWare Win7 | 0.5 | 1.4 | 1.5 |
| MBA11 Win7 (Boot Camp) | 0.7 | 16 | 23 |
| MBA11 Win7 (Boot Camp) | 0.7 | 15.9 | 23 |
| MBA11 VMWare Win7 | 0.4 | 4.4 | 6.1 |
| MBA11 VMWare Win7 | 0.4 | 4.4 | 6.1 |
| MBP13 Win7 – Average | 1 | 6.65 | 9.4 |
| MBA11 Win7 – Average | 0.7 | 15.95 | 23 |
| MBA11 VMWare Win7 – Average | 0.4 | 4.4 | 6.1 |
| MBP13 VMWare Win7 – Average | 0.5 | 1.4 | 1.5 |

