Moving graphs from Google Sheets or Excel to your Google doc is fairly simple, but you can save yourself that step by generating a graph in Google Docs directly using a free add-on called g(Math). This is especially useful for teachers who need to create tests containing multiple graphs.
Do you want to insert properly formatted equations into your Google Doc? g(Math) can do that, too. Read my tutorial here.
1.Click on the Add-ons tab in the Google Docs menu bar, and select Get Add-ons.
2.Search or scroll through the list until you see g(Math). Click on it, and then click the blue add button to install it for free. A window requesting permission for g(Math) to access your Google Drive files will appear. Click Allow.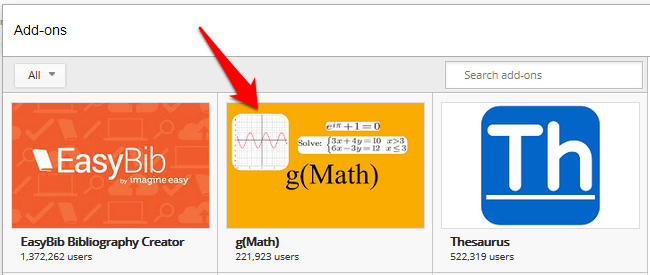
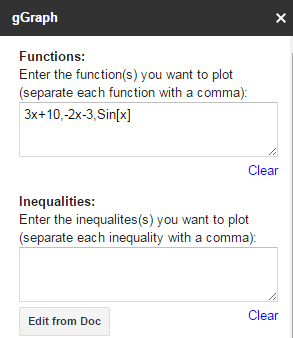
3.Go back to Add-ons in the Google Docs menu, select g(Math), and then Create a graph. A panel will appear in the right edge of your document. 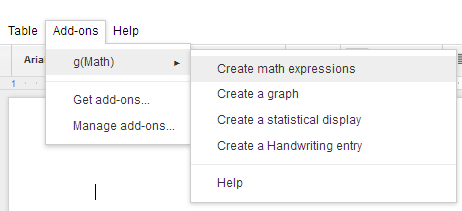
4.Type in the functions you want to graph into the top box. If you want multiple lines plotted on the same graph, separate them with a comma. Use the second box if you are graphing inequalities.
If you are unsure of how to type in a function such as a log or trig function, scroll down to the Mathematical Constants and Functions section, and click on the item you would to add to your graph. It will appear in the function box. From here, you can alter the function to fit your needs.
5.Use the Graph Zoom Region section to set the boundaries of your graph. The x-Step and y-Step determine what intervals are labeled on your x and y axes. When you are ready, click Insert in doc to create your graph at your current place in the document.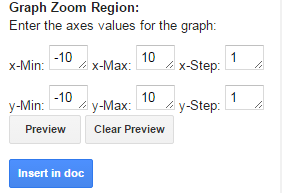
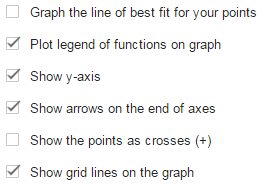
6.Scroll down to the bottom of the gGraph panel to see the formatting options. Use the check boxes to turn on and off a best fit line, legend, y-axis, arrows on end of axes, point markers, and grid lines.